How to Read a MoneyFlow Graph?
 The MoneyFlow Graph visually represents a trail, showing how funds move from one address to another. Here’s how to interpret it:
1. Understanding the Flow Direction
- The left side represents incoming transactions (funds received).
- The right side represents outgoing transactions (funds sent).
- Each node is an address.
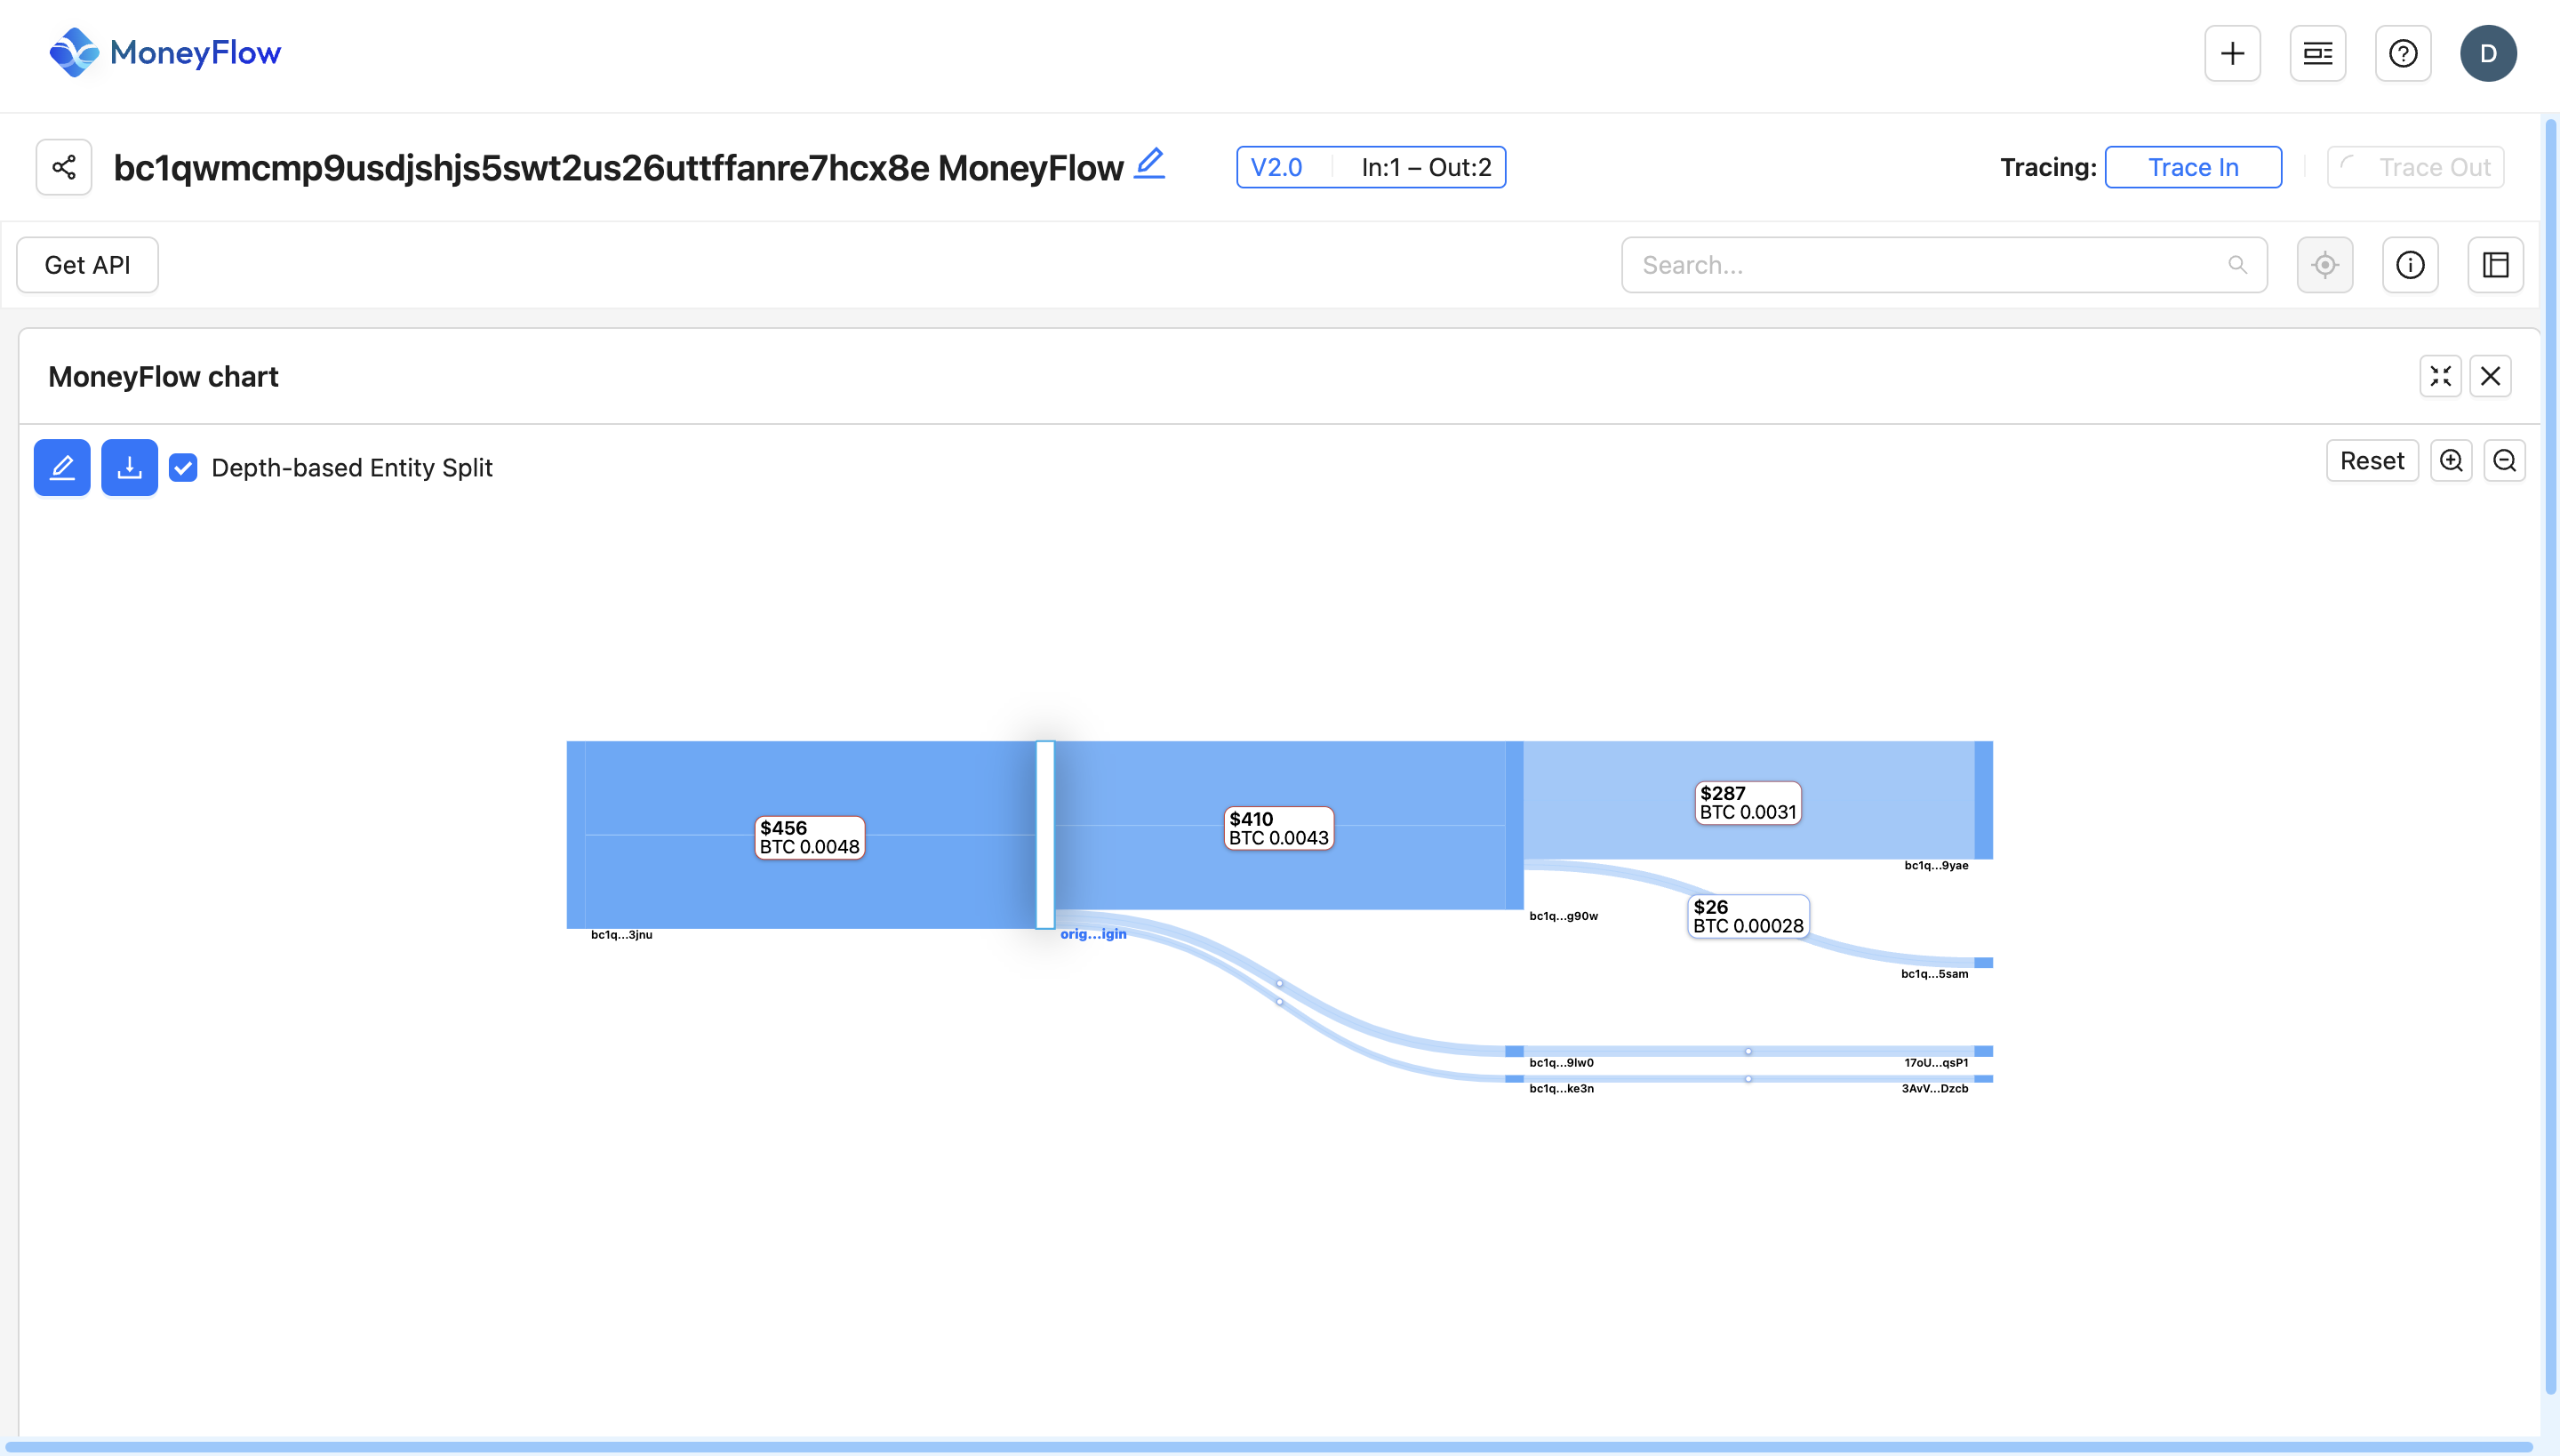
2. Transaction Amounts & Labels
- Each box (node) represents a Bitcoin address.
- The labels on each flow line show the amount of BTC transferred and its USD value at that time.
- Larger transactions have wider bars, while smaller transactions have narrower bars.
3. Depth-Based Entity Split
- The depth levels (vertical layers) show how money moves through different entities.
- The further right a transaction appears, the more steps it has gone through before reaching its final destination.
- This helps track the origins and distribution of Bitcoin across multiple transactions.
4. Color & Size Indicators
- The thickness of each flow represents the size of the transaction.
- Darker or wider lines indicate larger BTC transactions, while lighter or thinner lines indicate smaller BTC movements.
5. Tracing Transactions
- Click on an edge (flow line) to get more details about the transaction.
- Use "Trace In" to follow funds backward (where the BTC came from).
- Use "Trace Out" to follow funds forward (where the BTC was sent).
- Clicking on an address provides options to generate reports or add tags.
6. Filters & Custom Views
- Use the search bar to locate specific addresses.
- The reset button allows you to clear filters and return to the original view.
- Click on “Show underlying assets” to reveal additional asset details associated with an address.