Creating a Heatmap for Ethereum Token Holders using Python
In this tutorial we will see how to visualize top token holders in a heatmap using the Token Holder APIs with Python.
-
Import libraries: Necessary Python libraries are imported including
requestsfor making HTTP requests,jsonfor parsing JSON data,pandasfor data manipulation and analysis,seabornandmatplotlibfor data visualization.import requestsimport jsonimport pandas as pdimport seaborn as snimport numpy as npimport matplotlib.pyplot as plt -
Define API URL and headers: The Bitquery Streaming API URL is defined along with necessary headers including content type, API key, and authorization token.
url = "https://streaming.bitquery.io/graphql"headers = {'Content-Type': 'application/json','Authorization': 'Bearer ory_at_...'} -
Create the payload: The payload consists of a GraphQL query that fetches the top 50 token holders of a specific Bitfinex LEO Token (
0x2af5d2ad76741191d15dfe7bf6ac92d4bd912ca3) on a specific date. You can read more about Token Holder APIs herepayload = json.dumps({"query": "{\nEVM(dataset: archive, network: eth) {\nTokenHolders(\ndate: \"2024-02-01\"\ntokenSmartContract: \"0x2af5d2ad76741191d15dfe7bf6ac92d4bd912ca3\"\nlimit: {count: 50}\norderBy: {descending: Balance_Amount}\n) {\nHolder {\nAddress\n}\nBalance {\nAmount\n}\n}\n}\n}\n","variables": "{}"}) -
Make the API request: A POST request is sent to the Bitquery Streaming API with the headers and payload. The response is then saved in the
responsevariable.response = requests.request("POST", url, headers=headers, data=payload) -
Parse the response: The JSON response is parsed and the relevant data is extracted into a pandas DataFrame. The balance amounts are converted to float type and a new column
Amount_Shareis created which represents the proportion of each holder's balance to the total balance.data_json2 = response.json()holders = data_json2['data']['EVM']['TokenHolders']df_holders = pd.json_normalize(holders)df_holders['Balance.Amount'] = df_holders['Balance.Amount'].astype(float)total_amount = df_holders['Balance.Amount'].sum()df_holders['Amount_Share'] = df_holders['Balance.Amount'] / total_amount * 100 -
Create aliases for Ethereum addresses: To simplify the visualization, each unique Ethereum address is mapped to an alias.
aliases = {address: f"Ad_{i}" for i, address in enumerate(df_holders['Holder.Address'].unique())}df_holders['Alias'] = df_holders['Holder.Address'].map(aliases) -
Reshape data: The aliases and amount shares are reshaped into a 2D array preparing it to be rendered in a heatmap.
a = 10b = 5address_reshaped = df_holders['Alias'].values.reshape(a, b)amount_reshaped = df_holders['Amount_Share'].values.reshape(a, b) -
Create annotations: Annotations are created for the heatmap. These annotations consist of the pair of address alias and the corresponding amount share.
annotations = [f"{pair}\n{value:.3f}%" for pair, value in zip(address_reshaped.flatten(), amount_reshaped.flatten())]annotations = np.array(annotations).reshape(a, b) -
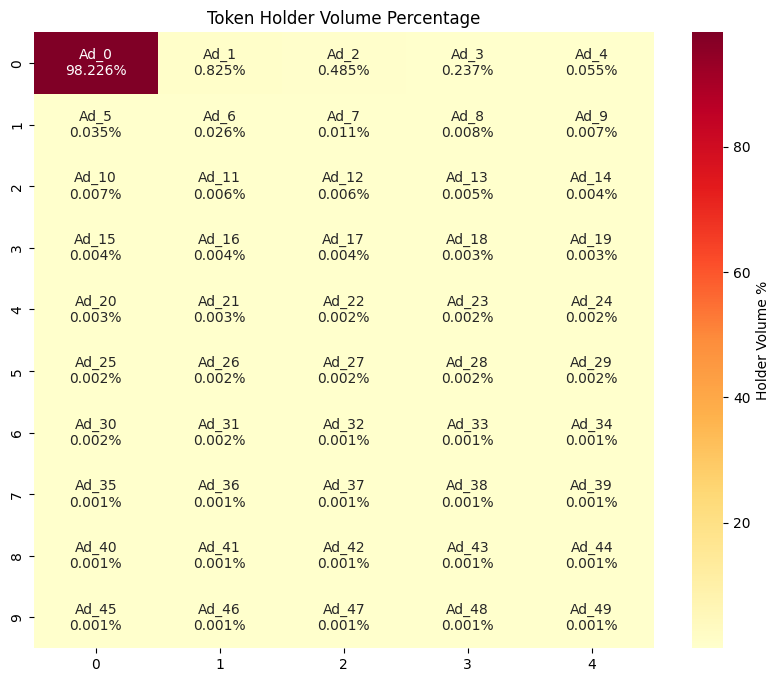
Plot the heatmap: Lastly, a heatmap is plotted using seaborn. The x and y labels represent the pairs of addresses, the color intensity indicates the amount share, and the annotations show the exact value of the amount share for each pair. The title of the plot is 'Token Holder Volume Percentage'.
plt.figure(figsize=(10, 8))sn.heatmap(amount_reshaped, annot=annotations, fmt="", cmap='YlOrRd', cbar_kws={'label': 'Holder Volume %'})plt.title('Token Holder Volume Percentage')plt.show()
Please note that you will need to replace the placeholder values in the script with your actual authorization token, and the smart contract address of the token you are interested in. Also, the reshaping dimensions (a=10, b=5) might need to be adjusted based on the number of token holders.
This is how it will look finally, you can change the heatmap palette based on your design.