Mempool Transaction Fee Explorer
In the world of cryptocurrency, understanding transaction fees and their dynamics is crucial for traders, investors, and blockchain enthusiasts alike. Ethereum, one of the leading blockchain platforms, relies on a concept known as the "Mempool" to manage pending transactions and determine their associated fees.
The Mempool API provides developers with a convenient interface to access real-time data from the Ethereum Mempool. By using the Mempool API, developers can get details about transactions, monitor how transaction fee changes, and learn more about what's happening on the Ethereum network.
In this blog, we'll explore the concept of the Mempool, delve into the functionalities of the Mempool API, and embark on a practical journey of building a transaction fee analysis dashboard using Python, Streamlit, and the Mempool API.
Building a Mempool Transaction Fee Analysis Dashboard with Streamlit
In this tutorial, we'll focus on a practical use case of utilizing the Mempool API to build a transaction fee analysis dashboard. This dashboard will offer users a comprehensive view of recent Ethereum transactions, including details such as transaction hashes, block numbers, sender and receiver addresses, transaction costs, and associated fees.
Moreover, we'll visualize key metrics such as burnt fees and priority fees per gas over time, allowing users to track fee trends and make informed decisions regarding transaction prioritization and fee optimization.
By the end of this tutorial, readers will have a solid understanding of how to interact with the Mempool API, fetch real-time transaction data, process it using Python libraries like Pandas and Matplotlib, and present it in an interactive dashboard using Streamlit.
Step 1: Importing Libraries and Defining Constants
import streamlit as st
import requests
import pandas as pd
import matplotlib.pyplot as plt
import json
In this section, we import necessary libraries: streamlit, requests, pandas, and matplotlib. These libraries will help us build our Streamlit web application and handle data visualization.
Step 2: Defining Constants and GraphQL Query
ACCESS_TOKEN = "Your_v2_Access_Token"
MEMPOOL_API_URL = "https://streaming.bitquery.io/graphql"
GRAPHQL_QUERY = """
{
  EVM(mempool: true) {
    Transactions(limit: {count: 200}) {
      Block {
        Time
        Number
      }
      Transaction {
        Hash
        Cost
        To
        From
      }
      Fee {
        Burnt
        SenderFee
        PriorityFeePerGas
        MinerReward
        GasRefund
        EffectiveGasPrice
        Savings
      }
    }
  }
}

"""
Here, we define constants such as ACCESS_TOKEN for the Mempool API and MEMPOOL_API_URL for its endpoint. We also define the GraphQL query (GRAPHQL_QUERY) that will retrieve transaction data from the Mempool API.
Step 3: Function to Fetch Data from the Mempool API
def fetch_data_from_mempool_api():
headers = {
'Content-Type': 'application/json',
'Authorization': f'Bearer {ACCESS_TOKEN}'
}
response = requests.post(MEMPOOL_API_URL, json={"query": GRAPHQL_QUERY}, headers=headers)
data = response.json()
return data['data']['EVM']['Transactions']
This function fetch_data_from_mempool_api() sends a POST request to the Mempool API endpoint with the GraphQL query and access token. It then returns the transaction data obtained from the response.
Step 4: Creating the Streamlit App
def main():
Set page title
st.title("Transaction Fee Analysis Dashboard")
Fetch data from Mempool API
try:
transactions_data = fetch_data_from_mempool_api()
except Exception as e:
st.error(f"Error fetching data from Mempool API: {str(e)}")
return
Here, we define the main function main() where we set the page title for our Streamlit app and attempt to fetch data from the Mempool API. We handle any exceptions that may occur during data retrieval.
Step 5: Processing and Displaying Data
Initialize lists to store data
block_time = []
block_number = []
transaction_hash = []
transaction_cost = []
transaction_to = []
transaction_from = []
fee_burnt = []
fee_sender = []
fee_priority = []
fee_miner = []
fee_refund = []
fee_effective_gas = []
fee_savings = []
Extract data from JSON and store in lists
for transaction in transactions_data:
block_time.append(transaction['Block']['Time'])
block_number.append(transaction['Block']['Number'])
transaction_hash.append(transaction['Transaction']['Hash'])
transaction_cost.append(transaction['Transaction']['Cost'])
transaction_to.append(transaction['Transaction']['To'])
transaction_from.append(transaction['Transaction']['From'])
fee_burnt.append(transaction['Fee']['Burnt'])
fee_sender.append(transaction['Fee']['SenderFee'])
fee_priority.append(transaction['Fee']['PriorityFeePerGas'])
fee_miner.append(transaction['Fee']['MinerReward'])
fee_refund.append(transaction['Fee']['GasRefund'])
fee_effective_gas.append(transaction['Fee']['EffectiveGasPrice'])
fee_savings.append(transaction['Fee']['Savings'])
Create DataFrame
df = pd.DataFrame({
'Block Time': block_time,
'Block Number': block_number,
'Transaction Hash': transaction_hash,
'Transaction Cost': transaction_cost,
'Transaction To': transaction_to,
'Transaction From': transaction_from,
'Fee Burnt': fee_burnt,
'Fee Sender': fee_sender,
'Fee Priority': fee_priority,
'Fee Miner': fee_miner,
'Fee Refund': fee_refund,
'Fee Effective Gas': fee_effective_gas,
'Fee Savings': fee_savings
})
Display DataFrame
st.subheader("Latest Transactions and Fee Details")
st.write(df)
In this section, we process the fetched transaction data by extracting relevant information and storing it in lists. Then, we create a Pandas DataFrame (df) to organize the data and display it using Streamlit.
Step 6: Visualizing Data
Initialize lists for fee data
timestamps = []
burnt_fees = []
priority_fees = []
Extract fee data from transactions
for transaction in transactions_data:
timestamps.append(pd.to_datetime(transaction['Block']['Time']))
burnt_fees.append(float(transaction['Fee']['Burnt']))
priority_fees.append(float(transaction['Fee']['PriorityFeePerGas']))
Create DataFrame
df = pd.DataFrame({
'Timestamp': timestamps,
'Burnt Fee': burnt_fees,
'Priority Fee': priority_fees
})
Set index to Timestamp for time-based plotting
df.set_index('Timestamp', inplace=True)
Display DataFrame
st.subheader("Latest Transactions and Fee Details")
st.write(df)
Plot bar chart for burnt fee over time
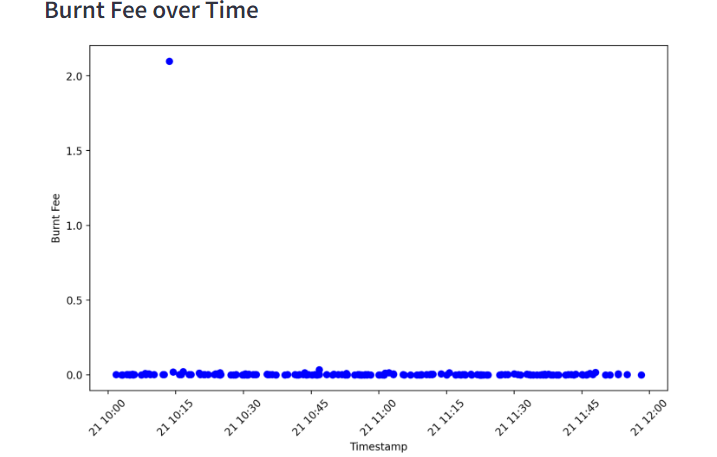
st.subheader("Burnt Fee over Time")
plt.figure(figsize=(10, 6))
plt.scatter(df.index, df['Burnt Fee'], color='blue')
plt.xlabel('Timestamp')
plt.ylabel('Burnt Fee')
plt.xticks(rotation=45)
st.pyplot(plt)
Plot bar chart for priority fee per gas over time
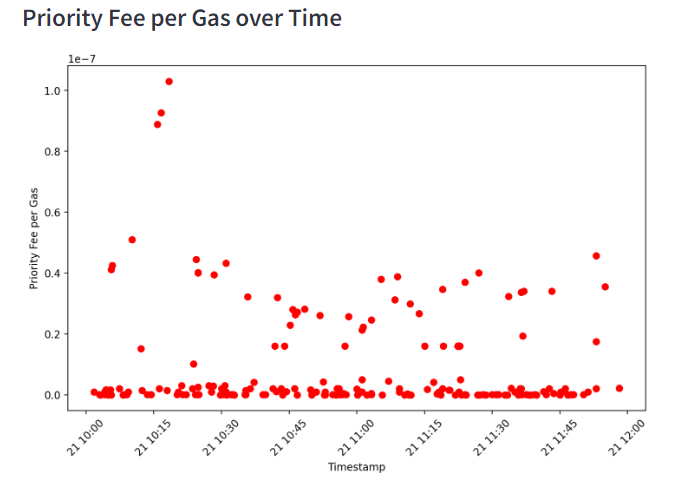
st.subheader("Priority Fee per Gas over Time")
plt.figure(figsize=(10, 6))
plt.scatter(df.index, df['Priority Fee'], color='red')
plt.xlabel('Timestamp')
plt.ylabel('Priority Fee per Gas')
plt.xticks(rotation=45)
st.pyplot(plt)
Here, we prepare fee data for visualization by extracting timestamps and fee values from transactions. We create another DataFrame (df) for visualization purposes, set the index to timestamps, and display it using Streamlit. Additionally, we plot bar charts for burnt fee and priority fee per gas over time using Matplotlib.
Step 7: Running the Streamlit App
if **name** == "**main**":
main()
Finally, we run the Streamlit app by calling the main() function if the script is executed directly. This is the entry point of our application.
Output
When you run the Streamlit app generated by the code, here's what you can expect to see:
- Latest Transactions and Fee Details: You will see a table displaying details of the latest transactions fetched from the Mempool API. The table includes information such as block time, block number, transaction hash, transaction cost, sender, receiver, and various fee details.

- Burnt Fee over Time: A scatter plot will show the burnt fee (the fee consumed by the network) over time. The x-axis represents the timestamp of transactions, and the y-axis represents the burnt fee value.
- Priority Fee per Gas over Time: Another scatter plot will display the priority fee per gas (the fee paid by the user for faster confirmation) over time. Similarly, the x-axis represents the timestamp, and the y-axis represents the priority fee per gas.
When interacting with the dashboard, users can analyze transaction data, identify patterns, and make informed decisions regarding transaction prioritization and fee management.
Overall, the dashboard offers a user-friendly interface for exploring and understanding Ethereum transaction fees in real-time, facilitating better decision-making in the realm of cryptocurrency transactions.