NFT Analytics Dashboard - Tutorial
Marketplace Analysis
Bitquery's queries can help NFT marketplace builders analyze the performance of different NFTs on various blockchain networks. By providing real-time data on transaction volume, and other key metrics, Bitquery can help builders optimize their marketplace's offerings and improve trading conditions for users.
Tutorial
This is a tutorial to build a NFT Dashboard using Python code that connects to the Bitquery API and retrieves data for a particular NFT on the Ethereum network. The code then displays the data on a user-friendly interface built using Python and Streamlit.
Required Libraries
The code uses the following libraries:
streamlit: A Python library for building web apps and visualizations http.client: A Python library for making HTTP requests json: A Python library for working with JSON data pandas: A Python library for data manipulation and analysis
Step by Step Code Implementation
Importing the Required Libraries
The first step in the code is to import the required libraries using the import statement:
import streamlit as st
import http.client
import json
import pandas as pd
Establishing Connection with the Bitquery API
Next, the code connects to the Bitquery API using the http.client library and retrieves data on NFT transactions for a specific contract on the Ethereum network using a GraphQL query. The query is passed as a JSON payload to the request() method, along with the necessary headers and API key.
conn = http.client.HTTPSConnection("streaming.bitquery.io")
payload = json.dumps({
   "query": "{\n  EVM(dataset: archive) {\n    DEXTrades(\n      where: {Trade: {Dex: {ProtocolFamily: {is: \"OpenSea\"}}, Buy: {Currency: {SmartContract: {is: \"0x322e2741c792c1f2666d159bcc6d3a816f98d954\"}}}}}\n    ) {\n      Count_NFTS_bought: sum(of: Trade_Buy_Amount)\n    }\n  }\n}\n",
   "variables": "{}"
})
headers = {
   'Content-Type': 'application/json',
    Authorization: "Bearer your_access_token_here",
}
conn.request("POST", "/graphql", payload, headers)
res = conn.getresponse()
data = res.read()
resp= json.loads( data.decode("utf-8"))

count_nfts_bought = resp['data']['EVM']['DEXTrades'][0]['Count_NFTS_bought']
The code retrieves the count of NFTs bought from the response data and stores it in the count_nfts_bought variable.
Displaying the Metric
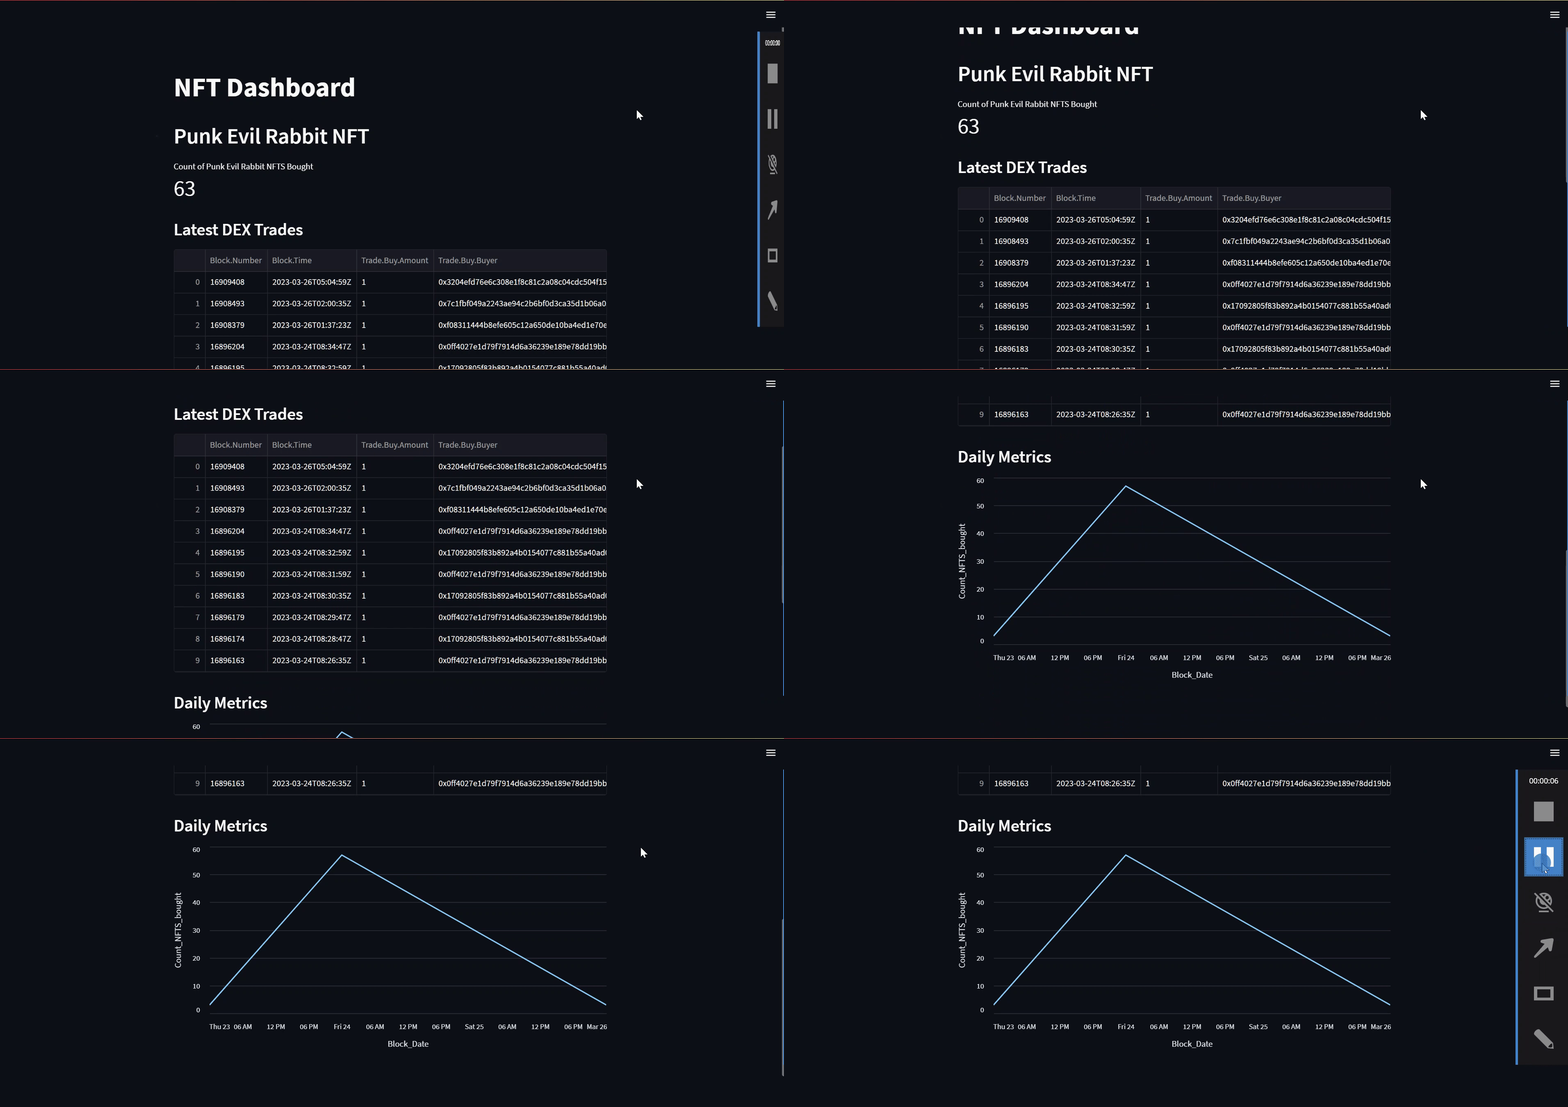
The code then displays the retrieved data in a Streamlit dashboard using the streamlit library. The dashboard includes a title, a header, a metric, a table, and a line chart.
st.title ("NFT Dashboard")
st.header("Punk Evil Rabbit NFT")
st.metric("Count of Punk Evil Rabbit NFTS Bought",count_nfts_bought)
The title() and header() methods are used to display the title and header of the dashboard, respectively. The metric() method is used to display the count of NFTs bought as a metric.
Adding a Table
This code snippet retrieves the latest DEX trades for a specific NFT token from the Ethereum blockchain using The Graph API, and displays them in a data table using the streamlit library.
payload_table = json.dumps({
    "query": "{\n  EVM(dataset: archive, network: eth) {\n    buyside: DEXTrades(\n      limit: {count: 10}\n      orderBy: {descending: Block_Time}\n      where: {Trade: {Buy: {Currency: {SmartContract: {is: \"0x322e2741c792c1f2666d159bcc6d3a816f98d954\"}}}}}\n    ) {\n      Block {\n        Number\n        Time\n      }\n      Transaction {\n        From\n        To\n        Hash\n      }\n      Trade {\n        Buy {\n          Amount\n          Buyer\n          Currency {\n            Name\n            Symbol\n            SmartContract\n          }\n          Seller\n          Price\n        }\n        Sell {\n          Amount\n          Buyer\n          Currency {\n            Name\n            SmartContract\n            Symbol\n          }\n          Seller\n          Price\n        }\n      }\n    }\n    sellside: DEXTrades(\n      limit: {count: 10}\n      orderBy: {descending: Block_Time}\n      where: {Trade: {Buy: {Currency: {SmartContract: {is: \"0x322e2741c792c1f2666d159bcc6d3a816f98d954\"}}}}}\n    ) {\n      Block {\n        Number\n        Time\n      }\n      Transaction {\n        From\n        To\n        Hash\n      }\n      Trade {\n        Buy {\n          Amount\n          Buyer\n          Currency {\n            Name\n            Symbol\n            SmartContract\n          }\n          Seller\n          Price\n        }\n        Sell {\n          Amount\n          Buyer\n          Currency {\n            Name\n            SmartContract\n            Symbol\n          }\n          Seller\n          Price\n        }\n      }\n    }\n  }\n}\n",
   "variables": "{}"
})

conn.request("POST", "/graphql", payload_table, headers)
res1 = conn.getresponse()
data1 = res1.read()
resp1= json.loads( data1.decode("utf-8"))

st.subheader("Latest DEX Trades")

data_table= resp1['data']['EVM']['buyside']
df = pd.json_normalize(data_table)
st.dataframe(df)
Adding a Chart
The chart section of the code creates a line chart using the streamlit library. The chart displays the number of NFTs bought on a daily basis on the OpenSea protocol on the Ethereum blockchain.
## chart
payload3 = json.dumps({
   "query": "{\n  EVM(dataset: archive) {\n    DEXTrades(\n      where: {Trade: {Dex: {ProtocolFamily: {is: \"OpenSea\"}}, Buy: {Currency: {SmartContract: {is: \"0x322e2741c792c1f2666d159bcc6d3a816f98d954\"}}}}}\n    ) {\n      Count_NFTS_bought: sum(of: Trade_Buy_Amount)\n      Block {\n        Date\n      }\n    }\n  }\n}\n",
   "variables": "{}"
})

conn.request("POST", "/graphql", payload3, headers)
res3 = conn.getresponse()
data3 = res3.read()

chart_data=json.loads(data3)['data']['EVM']['DEXTrades']

df_chart = pd.json_normalize(chart_data)
df_chart.columns = ['Count_NFTS_bought', 'Block_Date']
# Convert the 'Count_NFTS_bought' column to integer data type
df_chart['Count_NFTS_bought'] = df_chart['Count_NFTS_bought'].astype(int)
df_chart['Block_Date'] = pd.to_datetime(df_chart['Block_Date'])

st.subheader('Daily Metrics')
st.line_chart(df_chart,x='Block_Date',y='Count_NFTS_bought')
Here's how it looks 
If you want to build up query from scratch you are welcome or you can use the premade examples as well.
Setting Up Subscriptions
Lastly, we also have the the “subscribe” feature of the dApp. These functions are important as they allow us to continuously update the dApp for our users in real-time whenever a transaction of digital collectibles occurs in the marketplace.