Build Trading Indicators for Crypto Data
Technical indicators are a vital tool for cryptocurrency traders, as they can help to identify trends, predict price movements, and make informed trading decisions. For real-time price data with pre-calculated indicators, use our Crypto Price API.
With our new Crypto Price Stream we can get real-time crypto market data with Simple Moving Average (SMA), Exponential Moving Average (EMA), and Weighted Simple Moving Average (WSMA) at 1-second interval precalculated.
In this tutorial we will see how to stream them and calculate advanced trading indicators. This code is available readily as a Python package here
The list of indicators we will be calculating
- Simple Moving Average (SMA)
- Exponential Moving Average (EMA)
- Weighted Simple Moving Average
- Relative Strength Index (RSI)
- Volume Weighted Average Price (VWAP)
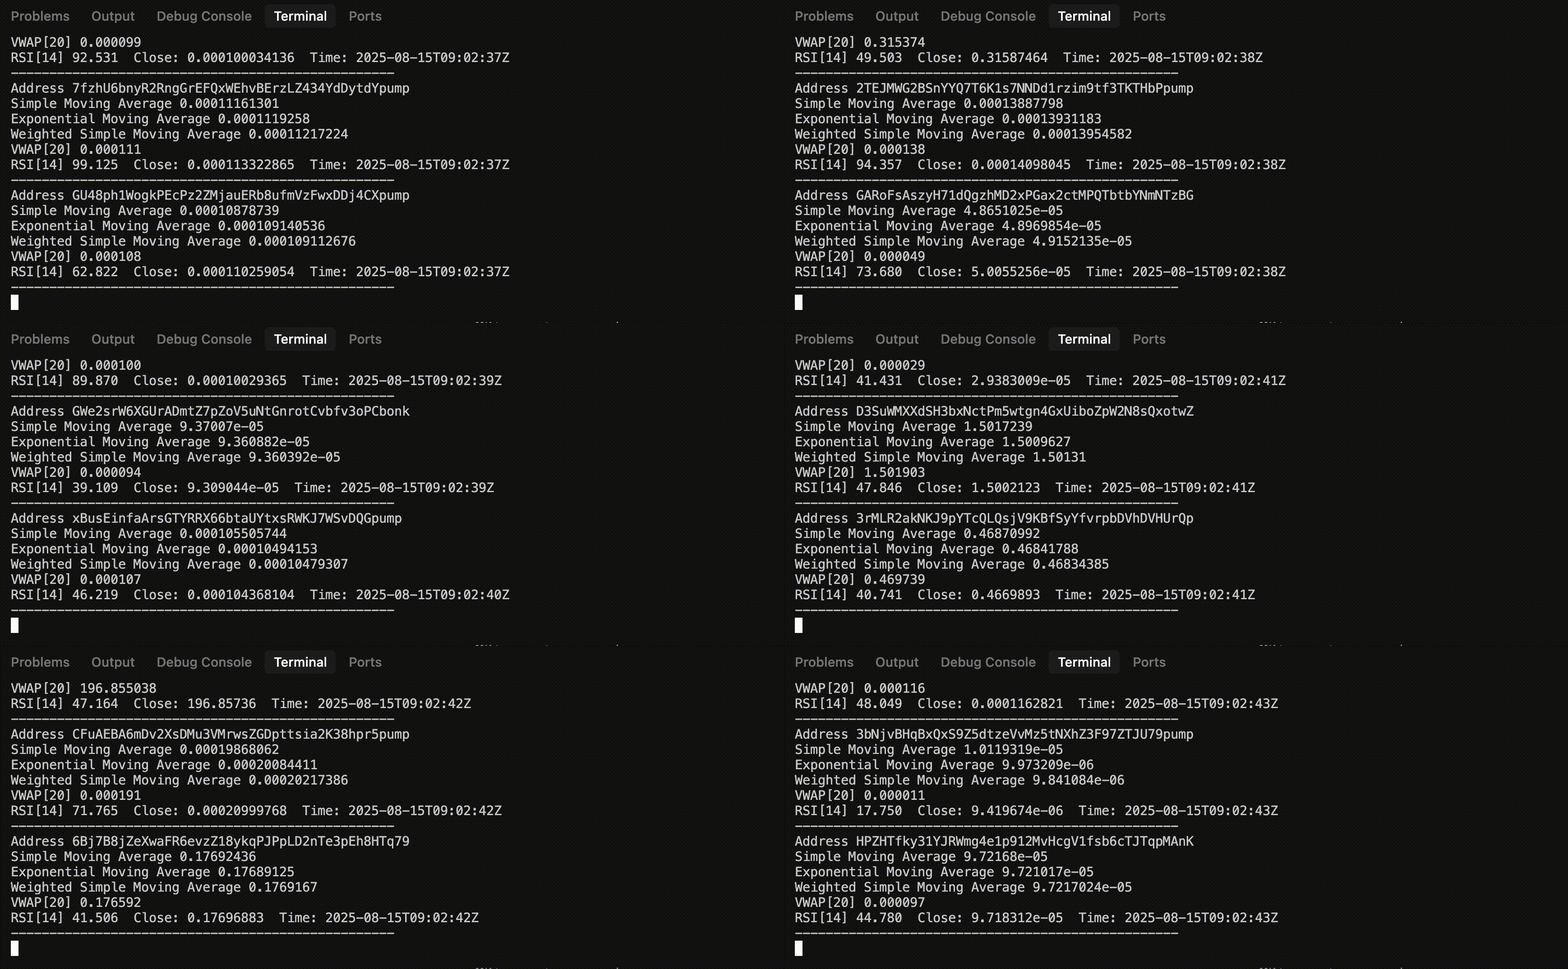
Sample Output

Step 1: Setup WebSocket Connection
from gql import gql
from gql.transport.websockets import WebsocketsTransport
import config  # oauth_token = "YOUR_TOKEN"

transport = WebsocketsTransport(
    url=f"wss://streaming.bitquery.io/graphql?token={config.oauth_token}",
    headers={"Sec-WebSocket-Protocol": "graphql-ws"}
)
await transport.connect()
print("Connected")
Remember: Replace YOUR_TOKEN with an OAuth token from your Bitquery account. You can generate it here
Step 2: Subscribe to the Price Feed
We write a query to get OHLC data for the Uniswap pair ETH-DAI, filtering for trades in the past 10 minutes and returning the volume, trade details, and block timestamps. You can extend the query to get data for longer duration of different periods like year/month/day.
We’ll request Solana token prices in 1-minute intervals, including SMA/EMA/WSMA.
query = gql("""
subscription {
  Trading {
    Tokens(
      where: { Token: { Network: { is: "Solana" } },
               Interval: { Time: { Duration: { eq: 1 } } } }
    ) {
      Token { Address Symbol }
      Interval { Time { End } }
      Volume { Base Quote Usd }
      Price {
        Ohlc { Close }
        Average { SimpleMoving ExponentialMoving WeightedSimpleMoving }
      }
    }
  }
}
""")

async for data in transport.subscribe(query):
    for t in data["Trading"]["Tokens"]:
        close = t["Price"]["Ohlc"]["Close"]
        sma = t["Price"]["Average"]["SimpleMoving"]
        ema = t["Price"]["Average"]["ExponentialMoving"]
        wsma = t["Price"]["Average"]["WeightedSimpleMoving"]
        # Choose a volume basis suitable for your use case
        volume = (t.get("Volume", {}).get("Base")
                  or t.get("Volume", {}).get("Quote")
                  or t.get("Volume", {}).get("Usd")
                  or 1.0)
        print(t["Token"]["Address"], sma, ema, wsma, close, volume)
Step 3: Calculate RSI in Real Time
We’ll keep RSI state in memory for each token and update it with Wilder’s smoothing.
rsi_period = 14
state = {}  # address → RSI state

def update_rsi(address, close):
    s = state.setdefault(address, {"prev_close": None, "avg_gain": 0, "avg_loss": 0, "count": 0, "initialized": False})
    if s["prev_close"] is None:
        s["prev_close"] = close
        return None

    delta = close - s["prev_close"]
    gain, loss = max(delta, 0), max(-delta, 0)

    if not s["initialized"]:
        s["avg_gain"] += gain
        s["avg_loss"] += loss
        s["count"] += 1
        if s["count"] >= rsi_period:
            s["avg_gain"] /= rsi_period
            s["avg_loss"] /= rsi_period
            s["initialized"] = True
    else:
        s["avg_gain"] = ((s["avg_gain"] * (rsi_period - 1)) + gain) / rsi_period
        s["avg_loss"] = ((s["avg_loss"] * (rsi_period - 1)) + loss) / rsi_period

    s["prev_close"] = close
    if not s["initialized"]:
        return None
    return 100 if s["avg_loss"] == 0 else 100 - (100 / (1 + s["avg_gain"] / s["avg_loss"]))
Step 4: Calculate VWAP (rolling window)
We maintain a small rolling window of prices and volumes per token for a simple, streaming VWAP.
from collections import defaultdict

vwap_period = 20
vwap_state = defaultdict(lambda: {"prices": [], "volumes": [], "pv_sum": 0.0, "vol_sum": 0.0})

def update_vwap(address, price, volume):
    s = vwap_state[address]
    s["prices"].append(price)
    s["volumes"].append(volume)
    if len(s["prices"]) > vwap_period:
        rp = s["prices"].pop(0)
        rv = s["volumes"].pop(0)
        s["pv_sum"] -= rp * rv
        s["vol_sum"] -= rv
    s["pv_sum"] += price * volume
    s["vol_sum"] += volume
    return s["pv_sum"] / s["vol_sum"] if s["vol_sum"] > 0 else price
Step 5: Putting It Together
Inside your subscription loop:
for t in data["Trading"]["Tokens"]:
    address = t["Token"]["Address"]
    close = t["Price"]["Ohlc"]["Close"]
    sma = t["Price"]["Average"]["SimpleMoving"]
    ema = t["Price"]["Average"]["ExponentialMoving"]
    wsma = t["Price"]["Average"]["WeightedSimpleMoving"]
    volume = (t.get("Volume", {}).get("Base")
              or t.get("Volume", {}).get("Quote")
              or t.get("Volume", {}).get("Usd")
              or 1.0)

    rsi = update_rsi(address, close)
    vwap = update_vwap(address, float(close), float(volume))
    if rsi is not None:
        print(f"{address} SMA:{sma} EMA:{ema} WSMA:{wsma} VWAP:{vwap:.6f} RSI:{rsi:.2f} Close:{close}")
Advantages of this approach:
- No polling — prices are pushed to you as soon as they’re available.
- Built-in indicators — SMA/EMA/WSMA come directly from Bitquery.
- Custom logic — you can add advanced indicators like RSI without losing speed.