TradingView API - Real-Time Crypto OHLC Stream
This guide is the entry point for the tutorial: how to embed TradingView Advanced Charts in a React app and drive the chart with Bitquery—historical OHLC over HTTPS and live OHLC over a GraphQL WebSocket subscription.
Complete reference implementation: github.com/bitquery/tradingview-subscription-realtime
Prefer a package? There is also an npm SDK (@bitquery/tradingview-sdk) if you want a higher-level integration; this documentation still helps you understand how the pieces fit together.
The chart loads history first, then extends the last candle as new OHLC arrives:
If this is your first time here
You do not need to read everything on this page before coding. Skim the tutorial order, complete the checklist, then open the first technical page: Getting Historical Data.
Come back here when something is unclear—especially Key concepts, Architecture, or When something goes wrong.
What you will build
By the end of the series you will have a small React application that:
- Renders a TradingView Advanced Chart (candlesticks, timeframes, drawing tools—whatever your TradingView license includes).
- Implements a custom datafeed: TradingView calls your code to load history and to subscribe to live updates.
- Fetches historical OHLC from Bitquery’s Crypto Price API (GraphQL over HTTP).
- Subscribes to pre-aggregated OHLC on a WebSocket so the chart updates without refreshing the page.
- Optionally normalizes bar continuity so adjacent candles meet cleanly on the chart (why and how).
Tutorial order (follow these pages)
The sidebar matches this sequence. Each page builds on the previous one.
| Step | Page | What you do there |
|---|---|---|
| 1 | Getting started (this page) | Context, setup, links |
| 2 | Getting Historical Data | HTTP GraphQL query, map rows to TradingView bars, sort, optional padding, connectBarContinuity |
| 3 | Bar continuity | Conceptual overview of stitching OHLC (historical + live) |
| 4 | Fetching Real-time OHLC | graphql-ws subscription, live bar updates, continuity across candle boundaries |
| 5 | Custom DataFeed Setup | Wire history + stream into TradingView’s getBars / subscribeBars contract |
| 6 | Widget Creation | TVChartContainer, load the charting library, pass your datafeed |
| 7 | Setting Up App.js | Mount the widget and run the app |
If you only want the idea of continuity, read Bar continuity after historical data; the historical page already shows the code.
Key concepts
TradingView: widget + datafeed
- Charting Library (Advanced Charts) is a browser JavaScript product. You host it inside your app (it is not a public CDN script you hotlink without a license).
- Your app creates a widget and hands it a datafeed object. TradingView then calls your functions, for example:
- “Give me bars from time A to B” → you return OHLCV arrays.
- “Subscribe to updates for this symbol/resolution” → you push new or updated bars when the market moves.
You are responsible for fetching that data; Bitquery is the backend in this tutorial.
Bitquery: one API, two transports
- Historical:
POSTa GraphQL query to Bitquery’s HTTP endpoint (this tutorial uses patterns aligned with the Crypto Price API). - Real-time: open a WebSocket connection and run a GraphQL subscription. Bitquery pushes new OHLC as it is finalized (for example per interval).
Same schema family conceptually; different mechanics than REST polling.
OHLC and “bars”
Each bar (candle) has:
- time — start of the period in milliseconds (Unix epoch), as TradingView expects in the UDF-style APIs used by custom datafeeds.
- open, high, low, close — prices for the interval.
- volume — base or quote volume depending on your query (stay consistent).
Aggregated OHLC from any provider can have open ≠ previous close. This tutorial includes continuity helpers so the chart still looks continuous; see Bar continuity.
Prerequisites
Must have
- Node.js 16+ (18 LTS is a safe choice).
- A Bitquery account and an OAuth token with access to streaming (see authorisation).
- TradingView Advanced Charts access: you must apply and receive their library; it is not optional for this integration path.
Architecture overview
At runtime, the pieces interact like this:
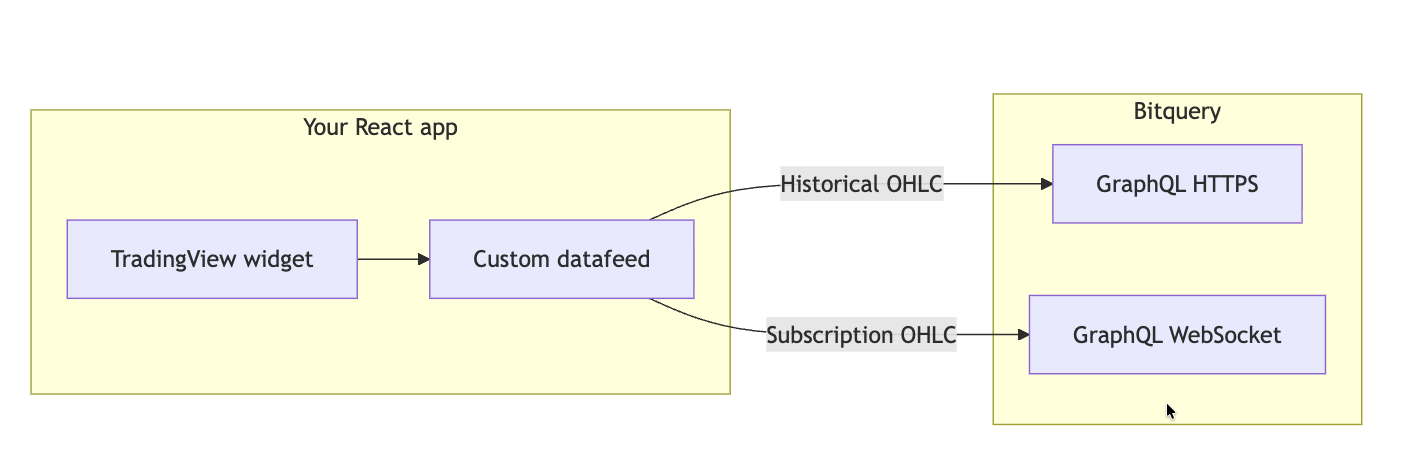
- First paint: the widget asks the datafeed for history; your code calls Bitquery over HTTPS, maps the result to bars, and returns them to TradingView.
- Live: the widget subscribes; your code opens a WebSocket subscription, receives each new bar, and forwards it to TradingView’s callback so the chart updates.
Clone the reference repo (fastest)
- Clone tradingview-subscription-realtime.
- Add your TradingView
charting_library(and any required folders) where the project expects them—see the repo README and Widget Creation. - Add your Bitquery token (see configuration below).
npm installandnpm start.
Installation and project layout
Create the React app
npx create-react-app tradingview-crypto-charts
cd tradingview-crypto-charts
Install npm dependencies
The tutorial code uses HTTP requests for history and graphql-ws for subscriptions (same as the reference repo):
npm install axios graphql-ws
Add TradingView’s library
After TradingView grants access, add their charting_library folder to your project (exact path is up to you, but it must match your import in the widget page—typically under src/ or public/). If your bundle includes a datafeeds folder, add it as well when the TradingView docs for your version require it.
Configuration: tokens and endpoints
The step-by-step pages use a configs.json file (for example in src/) to hold authtoken, matching the public GitHub tutorial style:
{
  "authtoken": "YOUR_BITQUERY_OAUTH_TOKEN"
}
Important:
- Add
configs.jsonto.gitignore(or use env vars and never commit secrets). - Your organization may use a different host or path (for example Enterprise endpoints). Use the URLs shown in your Bitquery dashboard; the tutorial often shows
https://streaming.bitquery.io/...andwss://streaming.bitquery.io/...patterns.
Alternative: Create React App supports REACT_APP_* variables in a .env file if you prefer not to use JSON; you would then read process.env.REACT_APP_BITQUERY_OAUTH_TOKEN in your modules instead of importing configs.json.
Supported networks (high level)
Bitquery’s Crypto Price and related trading APIs cover many chains; the exact list changes over time. Examples you will see in docs and IDE:
- EVM: Ethereum, BSC, Polygon, Arbitrum, Optimism, Base, and other EVM networks exposed in the schema.
- Solana: Raydium, Orca, Pumpfun, PumpSwap, and other Solana DEXs where the API exposes them.
- Other: Tron and additional networks as listed in the current schema.
Always confirm your network name and token address format in the IDE schema explorer or main Crypto Price API documentation before shipping.
Queries and streams to try first
Test these in Bitquery IDE before you paste them into JavaScript:
Suggested workflow: change network, token address, and interval in the IDE until the shape of the response matches what you expect; only then embed the query in your app.
Key features (summary)
Real-time streaming
- Pre-aggregated OHLC over a GraphQL subscription (low-latency updates compared to polling).
- You control which token and interval you subscribe to in the
whereclause.
Historical data
- Load a window of bars for the user’s visible range; TradingView may request more as they scroll.
- Aggregated OHLC reduces the work you would otherwise do from raw trades.
Data quality notes
- Bar continuity — optional normalization so candles meet visually (Bar continuity).
- DEX aggregation — Bitquery’s price products combine liquidity across venues; see the Crypto Price API docs for methodology and limits.
When something goes wrong
| Symptom | What to check |
|---|---|
| Blank chart, no errors | TradingView library path wrong or widget not mounted; browser console for failed script loads. |
401 / unauthorized from Bitquery | OAuth token missing, expired, or wrong header; Enterprise vs public endpoint mismatch. |
| History loads, live never updates | WebSocket URL or token query param; subscription where clause too narrow; firewall blocking wss://. |
| Gaps between candles | Expected for raw aggregated OHLC; implement Bar continuity if you want visual stitching. |
| “TradingView is undefined” | Import path to charting_library does not match where you copied the files. |
For Bitquery-specific errors, see support.
Community and support
- Telegram: Bitquery Developers
- Email: support@bitquery.io
Next step
Open Getting Historical Data and create histOHLC.js: that file is the foundation for everything the chart paints before the WebSocket connects.