Monitoring Solana at Scale: Managing 100s of Addresses
This guide demonstrates how to monitor real-time token transfers and DEX trades for hundreds of blockchain addresses efficiently using WebSockets and Streamlit. Learn to dynamically track and display key transfer and trade details in a real-time dashboard.
Monitoring 100s of Addresses on Solana Transfers in Real-Time
This section walks through how to track real-time Solana token transfers using a WebSocket connection and display sender, receiver, amount, and time in a dynamic Streamlit dashboard.
1. Setting Up the Environment
First, ensure that you have the necessary dependencies installed:
pip install streamlit pandas gql
Then, import the following libraries:
import asyncio
import pandas as pd
import streamlit as st
from gql import Client, gql
from gql.transport.websockets import WebsocketsTransport
Set your Bitquery API token:
TOKEN = "your_bitquery_api_token"
2. Preparing the List of Addresses
Define the list of Solana addresses you want to monitor:
addresses = [
    "7Ppgch9d4XRAygVNJP4bDkc7V6htYXGfghX4zzG9r4cH",
    "G6xptnrkj4bxg9H9ZyPzmAnNsGghSxZ7oBCL1KNKJUza",
    # Add more addresses here...
]
3. Creating the Transfer Subscription Query
The following function dynamically generates a GraphQL query to monitor token transfers for the specified addresses:
def create_transfer_subscription_query():
    address_list = ', '.join(f'"{addr}"' for addr in addresses)
    return gql(f"""
   subscription {{
    Solana {{
        Transfers(
            where: {{
                Transfer: {{ Sender: {{ Address: {{ in: [ {address_list} ] }} }} }}
            }}
        ) {{
            Transfer {{
                Amount
                AmountInUSD
                Receiver {{
                    Address
                }}
                Sender {{
                    Address
                }}
                Currency {{
                    Symbol
                }}
            }}
        }}
    }}
}}
    """)
4. Monitoring Real-Time Transfers
The monitor_transfers function sets up a WebSocket connection and subscribes to real-time transfer data. The results are displayed in real-time using a Streamlit dashboard.
async def monitor_transfers():
    transport = WebsocketsTransport(
        url=f"wss://streaming.bitquery.io/eap?token={TOKEN}",
        headers={"Sec-WebSocket-Protocol": "graphql-transport-ws"}
    )

    await transport.connect()
    print("Connected to WebSocket for transfer monitoring.")

    transfers_df = pd.DataFrame()

    # Set up Streamlit display for transfers
    st.title("Solana Transfer Monitoring Dashboard")
    table = st.empty()  # Initialize an empty Streamlit table

    try:
        query = create_transfer_subscription_query()
        async for result in transport.subscribe(query):
            if result.data:
                print("Transfer Data:", result.data)
                transfer_data = pd.json_normalize(result.data['Solana']['Transfers'])

                # Select only the relevant fields
                display_data = transfer_data[[
                    'Transfer.Sender.Address',
                    'Transfer.Receiver.Address',
                    'Transfer.Amount',
                    'Transfer.AmountInUSD',
                    'Transfer.Currency.Symbol'
                ]]

                transfers_df = pd.concat([transfers_df, display_data], ignore_index=True)

                # Update the Streamlit table with the new data
                with st.spinner('Updating data...'):
                    table.dataframe(transfers_df, use_container_width=True)

    except Exception as e:
        print("Error during transfer monitoring:", e)
    finally:
        await transport.close()
5. Running the Transfer Monitoring Dashboard
To run the real-time monitoring dashboard, use the following command:
streamlit run your_script.py
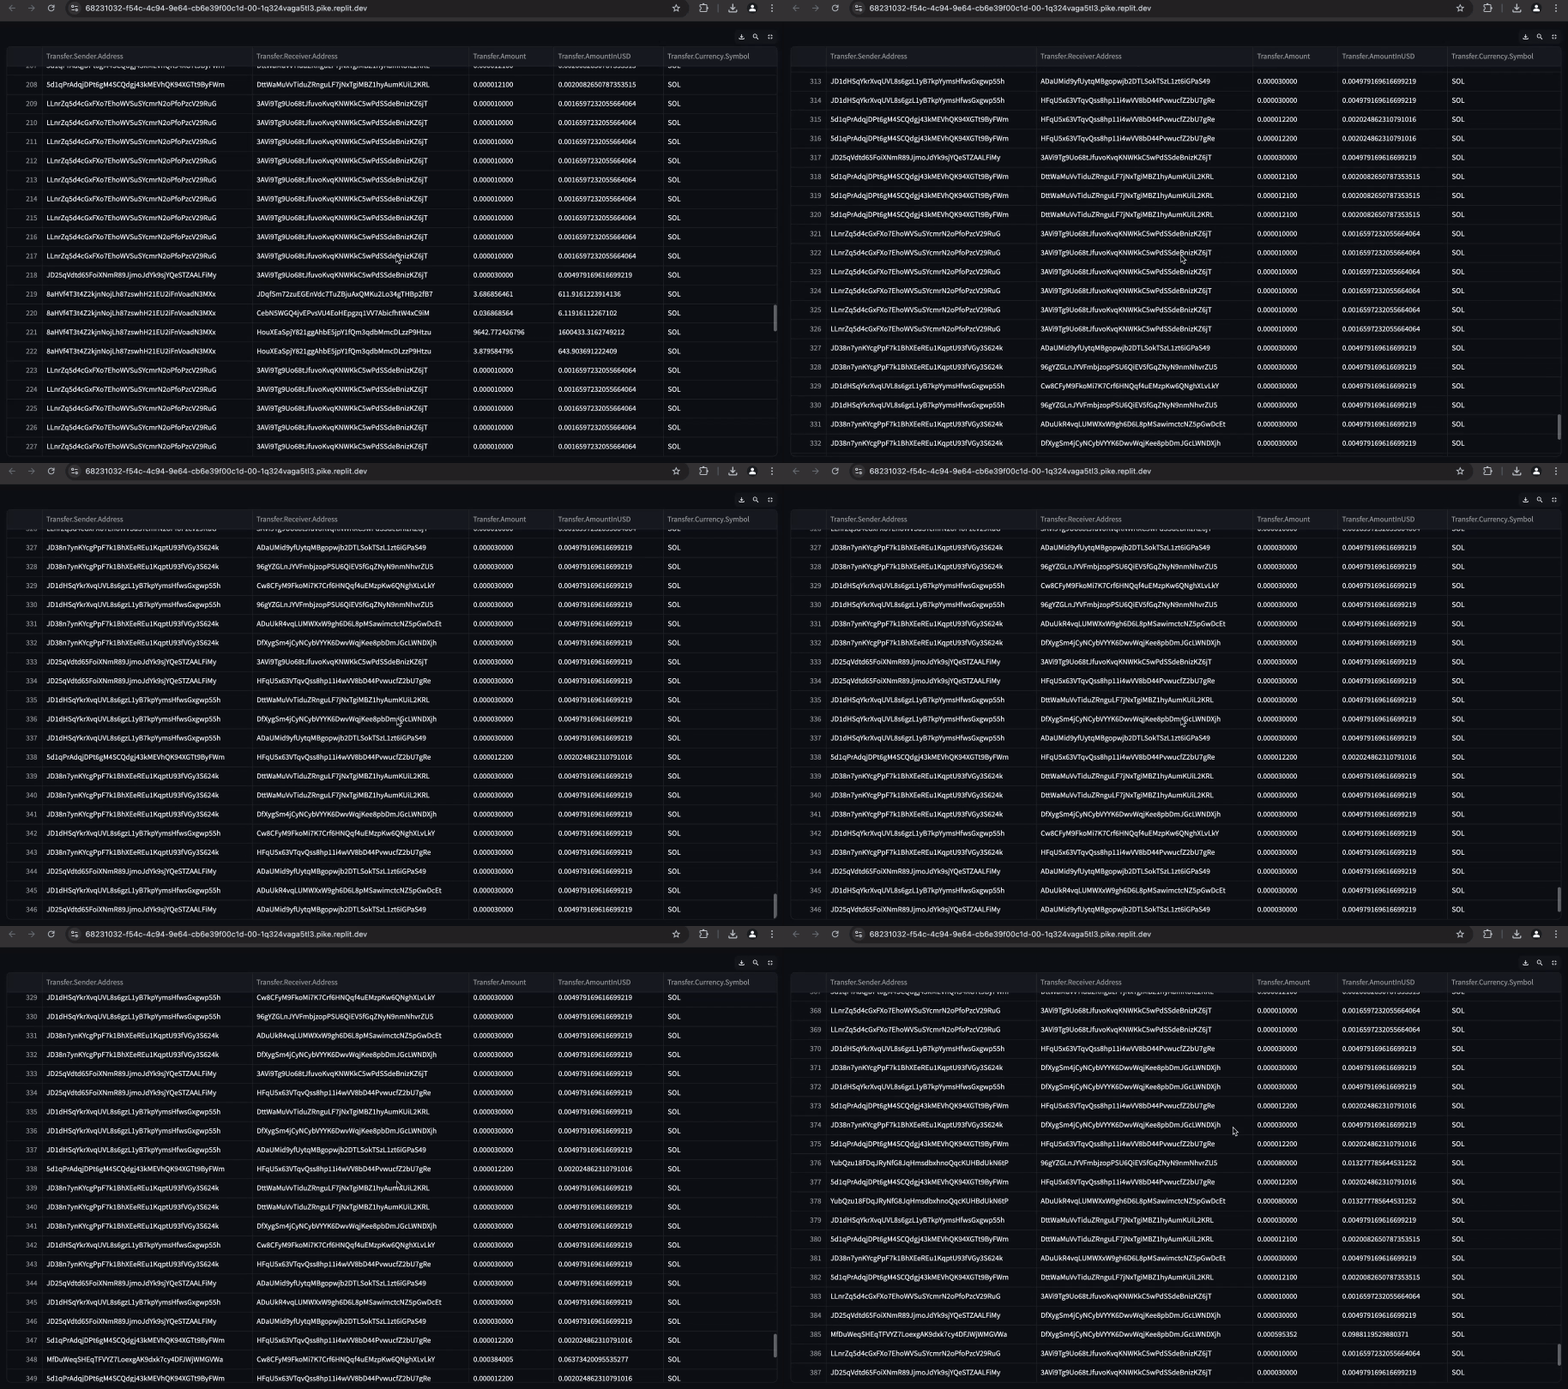
The dashboard will open in your browser, where you will see real-time updates of Solana transfers for the specified addresses.
Output
This is how it will look.

Scaling the Monitoring
-
Initial tests were conducted with 50 addresses, yielding fast response times.
-
Increased the number of addresses to 150, and the response speed remained consistent without any noticeable delay.
-
Further tested with over 500 addresses, and again, no visible latency was observed.
-
The response time remained relatively quick even as the number of addresses increased, demonstrating the scalability and efficiency of the system.
Monitoring Solana DEX Trades for 100s of Addresses
This section explains how to monitor real-time DEXTrades on Solana, displaying buy/sell data, trade prices, and other relevant trade information for hundreds of addresses.
1. Setting Up the Environment
Ensure that you have the necessary libraries installed:
pip install streamlit pandas gql
Import the necessary libraries:
import asyncio
import pandas as pd
import streamlit as st
from gql import Client, gql
from gql.transport.websockets import WebsocketsTransport
Set your Bitquery API token:
TOKEN = "your_bitquery_api_token"
2. Preparing the List of Addresses
Define the list of Solana addresses you want to monitor for DEX trades:
addresses = [
    "5qrvgpvr55Eo7c5bBcwopdiQ6TpvceiRm42yjHTbtDvc",
    "FpCMFDFGYotvufJ7HrFHsWEiiQCGbkLCtwHiDnh7o28Q",
    # Add more addresses here...
]
3. Creating the DEXTrades Subscription Query
This function dynamically generates a GraphQL query to monitor DEX trades involving the specified addresses:
def create_dex_trades_subscription_query():
    address_list = ', '.join(f'"{addr}"' for addr in addresses)
    return gql(f"""
        subscription {{
            Solana {{
                DEXTrades(where: {{Trade: {{Buy: {{Account: {{Address: {{in: [{address_list}]}}}}}}}}}}) {{
                    Trade {{
                        Dex {{
                            ProgramAddress
                            ProtocolName
                        }}
                        Buy {{
                            Amount
                            Account {{
                                Address
                            }}
                            Currency {{
                                Symbol
                                Name
                            }}
                            Price
                        }}
                        Sell {{
                            Account {{
                                Address
                            }}
                            Price
                        }}
                    }}
                }}
            }}
        }}
    """)
4. Monitoring Real-Time DEXTrades
The following function establishes a WebSocket connection and subscribes to real-time DEXTrades, displaying the results in a Streamlit dashboard:
async def monitor_dex_trades():
    transport = WebsocketsTransport(
        url=f"wss://streaming.bitquery.io/eap?token={TOKEN}",
        headers={"Sec-WebSocket-Protocol": "graphql-transport-ws"},
    )

    await transport.connect()
    print("Connected to WebSocket for DEXTrades monitoring.")

    dex_trades_df = pd.DataFrame()

    # Set up Streamlit display for DEXTrades
    st.title("Solana DEXTrades Monitoring Dashboard")
    table = st.empty()  # Initialize an empty Streamlit table

    try:
        query = create_dex_trades_subscription_query()
        async for result in transport.subscribe(query):
            if result.data:
                print("DEXTrade Data:", result.data)
                dex_trade_data = pd.json_normalize(result.data["Solana"]["DEXTrades"])

                # Select only the relevant fields
                display_data = dex_trade_data[[
                    'Trade.Buy.Currency.Name',
                    'Trade.Buy.Currency.Symbol',
                    'Trade.Buy.Account.Address',
                    'Trade.Buy.Price',
                    'Trade.Sell.Account.Address',
                    'Trade.Sell.Price',
                    'Trade.Dex.ProgramAddress',
                    'Trade.Dex.ProtocolName'
                ]]

                dex_trades_df = pd.concat([dex_trades_df, display_data], ignore_index=True)

                # Update the Streamlit table with the new data
                with st.spinner("Updating data..."):
                    table.dataframe(dex_trades_df, use_container_width=True)

    except Exception as e:
        print("Error during DEXTrades monitoring:", e)
    finally:
        await transport.close()
5. Running the DEXTrades Monitoring Dashboard
To run the real-time DEXTrades monitoring dashboard, use the following command:
streamlit run your_script.py
The dashboard will open in your browser, showing real-time updates for DEXTrades involving the specified addresses.
Conclusion
This guide demonstrates how to efficiently monitor 100s of Solana addresses in real time using WebSockets and Streamlit. You can extend this code to handle additional blockchain events or customize the displayed data based on your specific needs.