Tutorial to build TradingView chart with real-time blockchain data (Streaming API version)
We will be building the demo in React using the lightweight-charts library. The chart is powered by the Crypto Price API (Trading.Tokens), which serves pre-aggregated, MEV-filtered OHLC with USD prices for the last ~30 days.
Building with the full TradingView Advanced Charting library instead? See the advanced tutorial series.
This is how it will look finally.
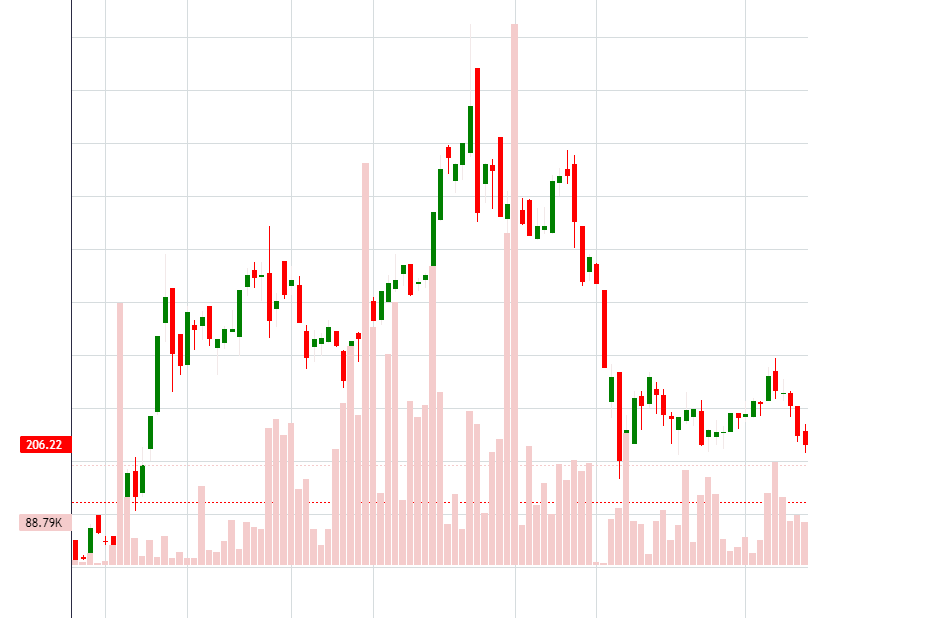
Step 1: Set up your React Environment Ensure you have a React application set up and ready for use. You should have a working React project with the necessary dependencies already installed. Create a project with
npx create-react-app demo
Step 2: Import Dependencies
In your React component file, import the required dependencies at the beginning of your file. These include React, useState, useEffect, useRef, and the necessary charting library (in this case, lightweight-charts).
import React, { useState, useEffect, useRef } from "react";
import { createChart, CrosshairMode } from "lightweight-charts";
import { getTimestampInMilliseconds } from "./utils";
Step 3: Create the React Component
Create a React functional component for your TradingView chart. You can name it something like TradingViewChart.
export default function TradingViewChart() {
  // State and Ref Declarations
  const [resdata, setData] = useState([]);
  const chartContainerRef = useRef();
  const chart = useRef();

  // useEffect Hook
  useEffect(() => {
    // Initialize the TradingView chart
    chart.current = createChart(chartContainerRef.current, {
      // Chart configuration options
      // ...
    });

    // Fetch and process data using the Streaming API
    const fetchData = async () => {
      // Fetch data from the API
      // ...

      if (response.status === 200) {
        // Process and format the data
        // ...
        // Create and populate candlestick and volume series
        // ...
      } else {
        console.log("error");
      }
    };

    fetchData();
  }, []);

  return (
    <div>
      <h1>Trade Data</h1>
      <div
        ref={chartContainerRef}
        className="chart-container"
        style={{ height: 800, width: 800 }}
      />
    </div>
  );
}
Step 4: Configure the Chart
In the useEffect hook, initialize the TradingView chart with the desired configuration options. Customize the chart layout, appearance, and any other settings based on your requirements.
chart.current = createChart(chartContainerRef.current, {
  width: chartContainerRef.current.clientWidth,
  height: chartContainerRef.current.clientHeight,
  layout: {
    backgroundColor: "#253248",
    textColor: "rgba(255, 255, 255, 0.9)",
  },
  crosshair: {
    mode: CrosshairMode.Normal,
  },
  rightPriceScale: {
    visible: false,
  },
  leftPriceScale: {
    visible: true,
  },
  timeScale: {
    borderColor: "#485c7b",
  },
});
Step 5: Fetch Data from the Streaming API
Create an async function named fetchData to fetch data from the Streaming API. You should use the fetch method to send a POST request to the API and retrieve the data.
The query below gets 200 hourly candles of WETH/USD OHLC from the Crypto Price API (Trading.Tokens) — pre-aggregated OHLC with USD prices and volume built in, MEV/outlier-filtered, so no in-query aggregation or price derivation is needed. Change Duration for other intervals (1, 60, 300, 900, 3600 seconds, etc.), and swap the token address/network for any other token. For candles older than the Trading API's ~30-day window, drop to DEXTradeByTokens aggregation.
const fetchData = async () => {
  const response = await fetch("https://streaming.bitquery.io/graphql", {
    method: "POST",
    headers: {
      "Content-Type": "application/json",
      Authorization: "Bearer YOUR_ACCESS_TOKEN",
    },
    body: JSON.stringify({
      query: `
       {
          Trading {
            Tokens(
              where: {
                Token: {Address: {is: "0xc02aaa39b223fe8d0a0e5c4f27ead9083c756cc2"}, Network: {is: "Ethereum"}}
                Interval: {Time: {Duration: {eq: 3600}}}
              }
              orderBy: {ascending: Block_Time}
              limit: {count: 200}
            ) {
              Interval { Time { Start Duration } }
              Price { Ohlc { Open High Low Close } }
              Volume { Base Usd }
            }
          }
        }
      `,
      variables: "{}",
    }),
  });

  // Process and populate the chart with the retrieved data
  // ...
};
Step 6: Process and Populate Data
Within the fetchData function, process and format the retrieved data according to your needs. This includes extracting relevant information and populating the candlestick and volume series of the chart.
if (response.status === 200) {
  // Process and format the data
  const recddata = await response.json();
  const responseData = recddata.data.Trading.Tokens;

  const extractedData = [];
  const extractedvol = [];
  responseData.forEach((record) => {
    // Extract necessary fields from Object
    const { Open: open, High: high, Low: low, Close: close } = record.Price.Ohlc;
    const recvol = parseFloat(record.Volume.Base);

    // lightweight-charts expects unix seconds for intraday candles
    const time = Math.floor(new Date(record.Interval.Time.Start).getTime() / 1000);

    const extractedItem = {
      open: open,
      high: high,
      low: low,
      close: close,
      time: time,
    };

    // Push the extracted object to the extractedData array
    extractedData.push(extractedItem);

    const extractvol = {
      value: recvol,
      time: time,
    };
    extractedvol.push(extractvol);
  });

  // Create candlestick and volume series on the chart
  // ...
  const candlestickSeries = chart.current.addCandlestickSeries({
          upColor: "#008000",
          downColor: "#FF0000",
          borderDownColor: "#FF0000",
          borderUpColor: "#008000",
          wickDownColor: "#FF0000",
          wickUpColor: "#f2e9e9",
        });
  candlestickSeries.setData(extractedData);
  const volumeSeries = chart.current.addHistogramSeries({
          priceFormat: {
            type: 'volume',
          },
          scaleMargins: {
            top: 0.8,
            bottom: 0,
          },
          overlay: true,
          priceScaleId: '',
          color:"#f4cccc"
        });

   volumeSeries.setData(extractedvol);
} else {
  console.log("error");
}
In this step, we format the data making it suitable for chart creation. The snippet reads the pre-aggregated Open, High, Low, Close values straight off Price.Ohlc (no aggregation needed) and converts the interval start time to the unix-seconds format lightweight-charts expects for intraday candles.
const { Open: open, High: high, Low: low, Close: close } = record.Price.Ohlc;
const recvol = parseFloat(record.Volume.Base);

const time = Math.floor(new Date(record.Interval.Time.Start).getTime() / 1000);

const extractedItem = {
  open: open,
  high: high,
  low: low,
  close: close,
  time: time,
};
Step 7: Render the Chart
Render the TradingView chart within your React component by returning the chart container div inside the component's JSX.
return (
  <div>
    <h1>Trade Data</h1>
    <div
      ref={chartContainerRef}
      className="chart-container"
      style={{ height: 800, width: 800 }}
    />
  </div>
);
Step 8: Customize Further
Customize the chart appearance, colors, and layout to meet your specific needs by adjusting the configuration options and series settings in the createChart and data population sections of your code.
That's it! You now have a React component that plots a TradingView chart using the Streaming API.
You can find the complete code here. Note: the repo may still show the older DEXTradeByTokens aggregation query — the Trading.Tokens query above is the current recommended data source; only the query string and the field extraction differ.
Ready to run this in production?
Get an API key and run these queries in minutes, or talk to us about plans and enterprise delivery.